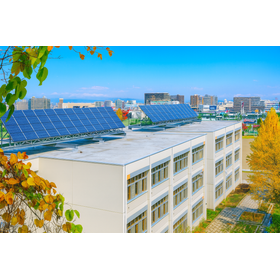
Visualization simulation of CO₂ reduction amount for industrial self-consumption solar power.


Industrial self-consumption solar power generation × CO₂ reduction simulation: It's not just about reducing electricity costs. Visualizing CO₂ reduction amounts accelerates decarbonization management!
Why is visualizing CO₂ reduction important? Three challenges of decarbonization management: 1. It is unclear how much CO₂ will be reduced by specific measures. 2. There is a need for evidence to appeal to business partners and shareholders about environmental contributions. 3. While there is a demand for ESG investment and SDGs compliance, it is unclear where to start.
basic information
〇 Solar power generation solves the problem ✅ Reason 1: Visualizing CO₂ reduction in numerical terms Estimating optimal power generation based on the area of factory and warehouse roofs Calculating "annual CO₂ reduction of ○ tons" through simulation Can be utilized in corporate sustainability reports and client reports ✅ Reason 2: Simultaneous reduction of electricity costs Cutting electricity costs by up to 28% through self-consumption of power Achieving both CO₂ reduction and cost reduction "at the same time" ✅ Reason 3: Zero initial costs with subsidies & PPA model Utilizing subsidies of up to 2/3 With PPA, implementation can be done with zero equipment costs
Price range
Delivery Time
Applications/Examples of results
【Case Study】 ■ Example: Hyogo Prefecture Automobile Parts Factory Installed Capacity: 300kW Annual Electricity Cost Reduction: Approximately 9,200,000 yen Annual CO₂ Reduction: Approximately 220 tons Effect: Promoting the improvement of the renewable energy ratio across the entire supply chain to business partners.
Related Videos
catalog(2)
Download All Catalogs

News about this product(1)
Distributors

Kenneth Energy Development Co., Ltd. is a company aiming to promote renewable energy, operating in the following three main areas: 〇 Energy development business centered on solar power generation - Comprehensive support from planning, design, construction, to operation of rooftop and ground-mounted solar power plants - Assistance with connection negotiations with power companies and various permit applications, ensuring a smooth introduction even for first-timers 〇 Electrical equipment construction business - Handling a wide variety of electrical work, including new construction and renovation of commercial facilities and apartments - Broad coverage of all equipment, including lighting, air conditioning, emergency power supply, water supply and drainage, and gas piping 〇 Real estate and construction support business - Involved in infrastructure development and project support related to construction, leveraging a comprehensive construction system as a strength Additionally, many qualified professionals, such as electrical chief engineers and construction management engineers, are on staff, providing strong support for companies in their decarbonization efforts and cost reduction with high technical skills and reliable responsiveness. In the solar power-related business and real estate-related business, we can provide a wide range of support from project sourcing and investigation stages to execution stages such as EPC, tailored to your needs.


